Johns Hopkins Turbulence Databases

Using the JHU Turbulence Database Matlab Analysis Tools
Download
Matlab Code: Turbmat-Tools-0.3.2 (Download tar.gz here) (Download zip here)
This downloads a directory which contains a set of Matlab analysis
tools. Included are several ready to use Matlab scripts that
provide functionality for plotting/animating velocity and
vorticity fields, computing and plotting longitudinal energy
spectra, and computing PDF's of velocity, pressure, and velocity
increments. Each script will prompt the user for any required
input information using GUI boxes so no modifications are required
by the user.
Note that a copy of Turbmat is required
for Turbmat-Tools to run. The latest copy of Turbmat can be
downloaded from here
Please see the README file for more information.
Overview
Turbmat-Tools is a Matlab package with six ready-to-use scripts that make use of the Turbmat package to fetch, process and visualize data from the JHU Turbulence Database Cluster. The Turbmat package provides a wrapper around Matlab web service functions for calling the JHU Turbulence Database Cluster. Turbmat-Tools provides example scripts for performing requests on the database. These scripts do not require any modification. All input data is obtained from the user by GUI input boxes.
All six scripts make use of the TurbTools class. This class, purposefully developed for Turbmat-Tools, contains a large set of useful functions to request, parse and visualize data from the database.
To increase the performance of this package, there has been implemented local caching functionality. This is accomplished by creating an extra layer between the Matlab code and the database, called TurbCache. The TurbCache class stores requests in a uniquely named cache file, and tries to retrieve a request straight from this cache file if possible. This then avoids the necesity of a direct expensive request on the database.
Provided Scripts
- turbm_pdf.m : By fetching a large cube of data, this script calculates the probability density functions (PDF) of quantities such as pressure, velocity components and velocity gradient components. The velocity gradient components are grouped in transverse and longitudinal sets, and logarithmically shown.
-
turbm_pdfVelocityIncrements.m : This scripts fetches a provided number of
blocks, consisting of 32x128x512 physical grid points, queried by 32x32x32
points. Within this block, we can calculate velocity increments ranging
from 1 physical grid point to 256 grid points. This is the equivalent of
around 2 to 550 Kolmogorov length scales. We can accumulate important
turbulence statistics from the velocity increments, such as skewness and
kurtosis. This script presents these statistics in a few graphs.
NOTE: The Matlab Statistics Toolbox is required for this script to work. - turbm_spectra1D.m : This script generates a provided number of randomly positioned and oriented lines, crossing the complete simulation domain present in the database. For all grid points that are on these lines, the inline velocity component is queried. For every single line, we now have a signal that can be transformed to the frequency domain, using Matlab's standard FFT function. The discrete Fourier transform of the line signals can be used to compute the energy spectrum. This energy spectrum is scaled and displayed by this script.
- turbm_vorticity3D.m : This script allows a user to fetch an arbitrary volume of points in a certain time step. From these evenly spaced points, we can calculate certain scalar quantities, such as Q-criterion, Lambda-2 or Vorticity magnitude, using the velocity gradient tensor components. When drawing iso-surfaces for the named quantities, the resulting structures will be representative for local vortex structures. This scripts will show these iso-surfaces, by using an interpolated 3D scalar field.
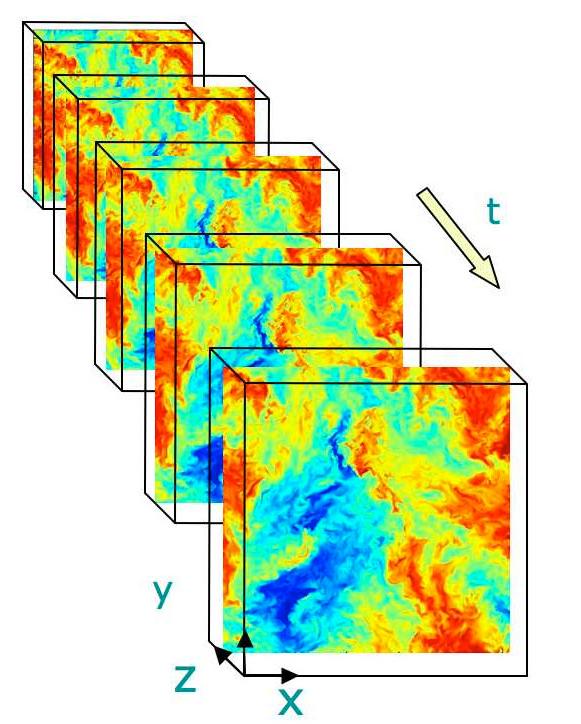
- turbm_velocity2D.m : We can extract 2D slices of points with arbitrary dimension, orientation and position. On these 2D surfaces, we can show all three velocity components by a 2D vector map and a colormap. This script allows a user to do so, by asking numerous input values. In addition, a user can look at absolute velocity components or to relative velocity components, with respect to their average values.
- turbm_velocity2Dzoom.m : This script has much resemblance with the 2D Velocity script. It applies the same code, using four steps to zoom in from 1024^2 points to 16^2 points. This allows a user to recognize both large scale structures in the 1024^2 surface, as well as small scale structures in the 16^2 one.
Last update: 12/2/2019 3:14:44 PM